
The biology is connected. Your data should be too.
DNA, RNA, and protein each reveal a different aspect of cellular biology. But when measured separately, researchers are left to piece together how those signals relate. Triomics brings them together in the same cell, revealing connections between genotype, gene expression, and phenotype that individual measurements cannot.

Modularity
Combine any analytes with DNA, RNA, protein, or both, to match your experimental design.

One assay, three analytes
Capture DNA, RNA, and protein readouts from a single Tapestri run.

No inferring, same sample
Every analyte is measured from the very same single cell, never a computational estimate.
One Platform, Four Ways to See the Cell
Configuration 1

DNA
Ideal for:
Precise clonal architecture at single-cell resolution, capturing every mutation in every cell rather than inferring it from bulk averages.
What it reveals:
• Clonal heterogeneity and subclone architecture
• Mutation co-occurrence and zygosity
• Variant allele frequency per clone
Configuration 2

DNA + RNA
Ideal for:
Confirming that a mutation actually drives a transcriptional consequence, not just correlates with it.
What it reveals:
• Pathway activation driven by specific clones
• Transcriptional state linked to genotype
• Aberrant expression patterns by mutation
Configuration 3

DNA + Protein
Ideal for:
Linking genotype directly to surface phenotype and immune cell identity in the same cell.
What it reveals:
• Immunophenotype and functional state by clone
• Surface marker expression tied to mutation
• How genotype shapes cell identity
Configuration 4

DNA + RNA + Protein
Ideal for:
Profiling genotype, transcriptome, and proteome co-occur in the same single cell.
What it reveals:
• Complete multi-modal profile per cell
• Clonal identity, transcriptional state, and protein expression together
• Genotype-to-phenotype consequence captured in one assay
“Triomics allows us to move beyond identifying which cells carry an ASXL1 mutation and begin asking what that mutation means for their biology. Integrating genotype, transcriptome, and protein in the same cell gives us a deeper understanding of myeloid disease progression.”
Dr. Terra Lasho, PhD, Assistant Professor Of Medicine, Mayo Clinic

Tapestri Pipeline and our Mosaic Python package resolve genotype, expression, and protein calls per cell. Clonal architecture, transcriptional state, and surface phenotype are integrated automatically, eliminating the need for manual reconciliation.
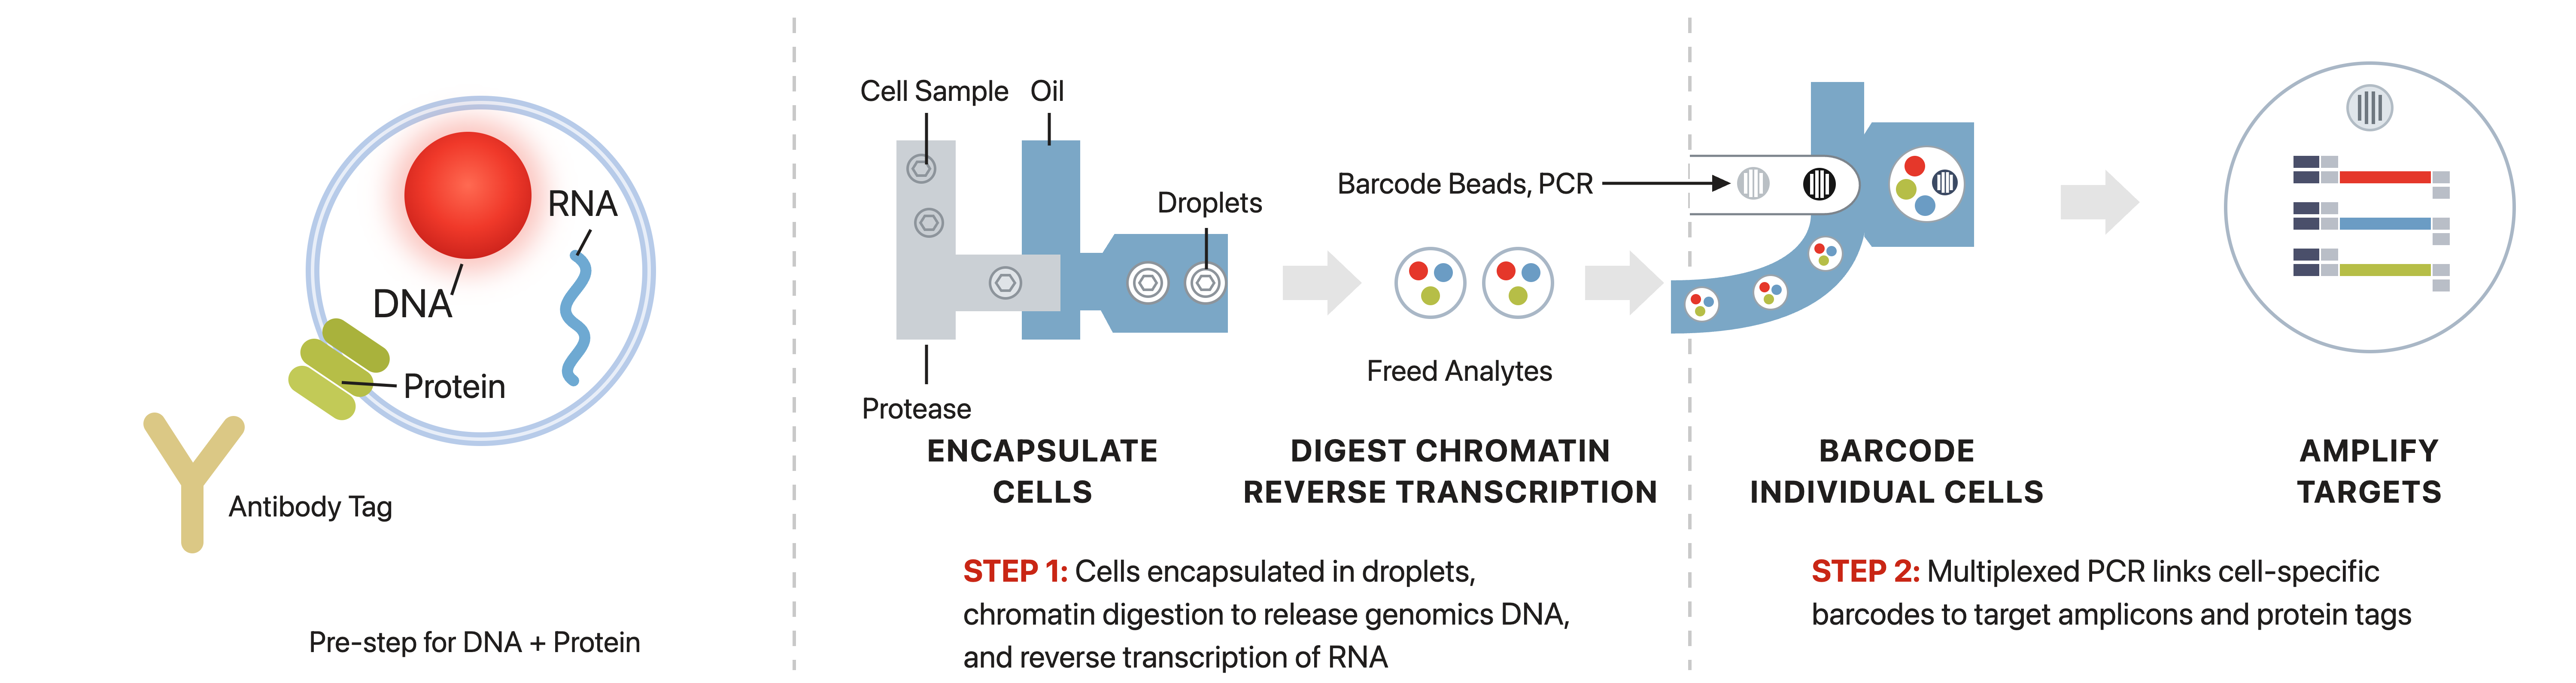
Tapestri Single-Cell Triomics Workflow
Same Cell, Three Complementary Layers of Biology
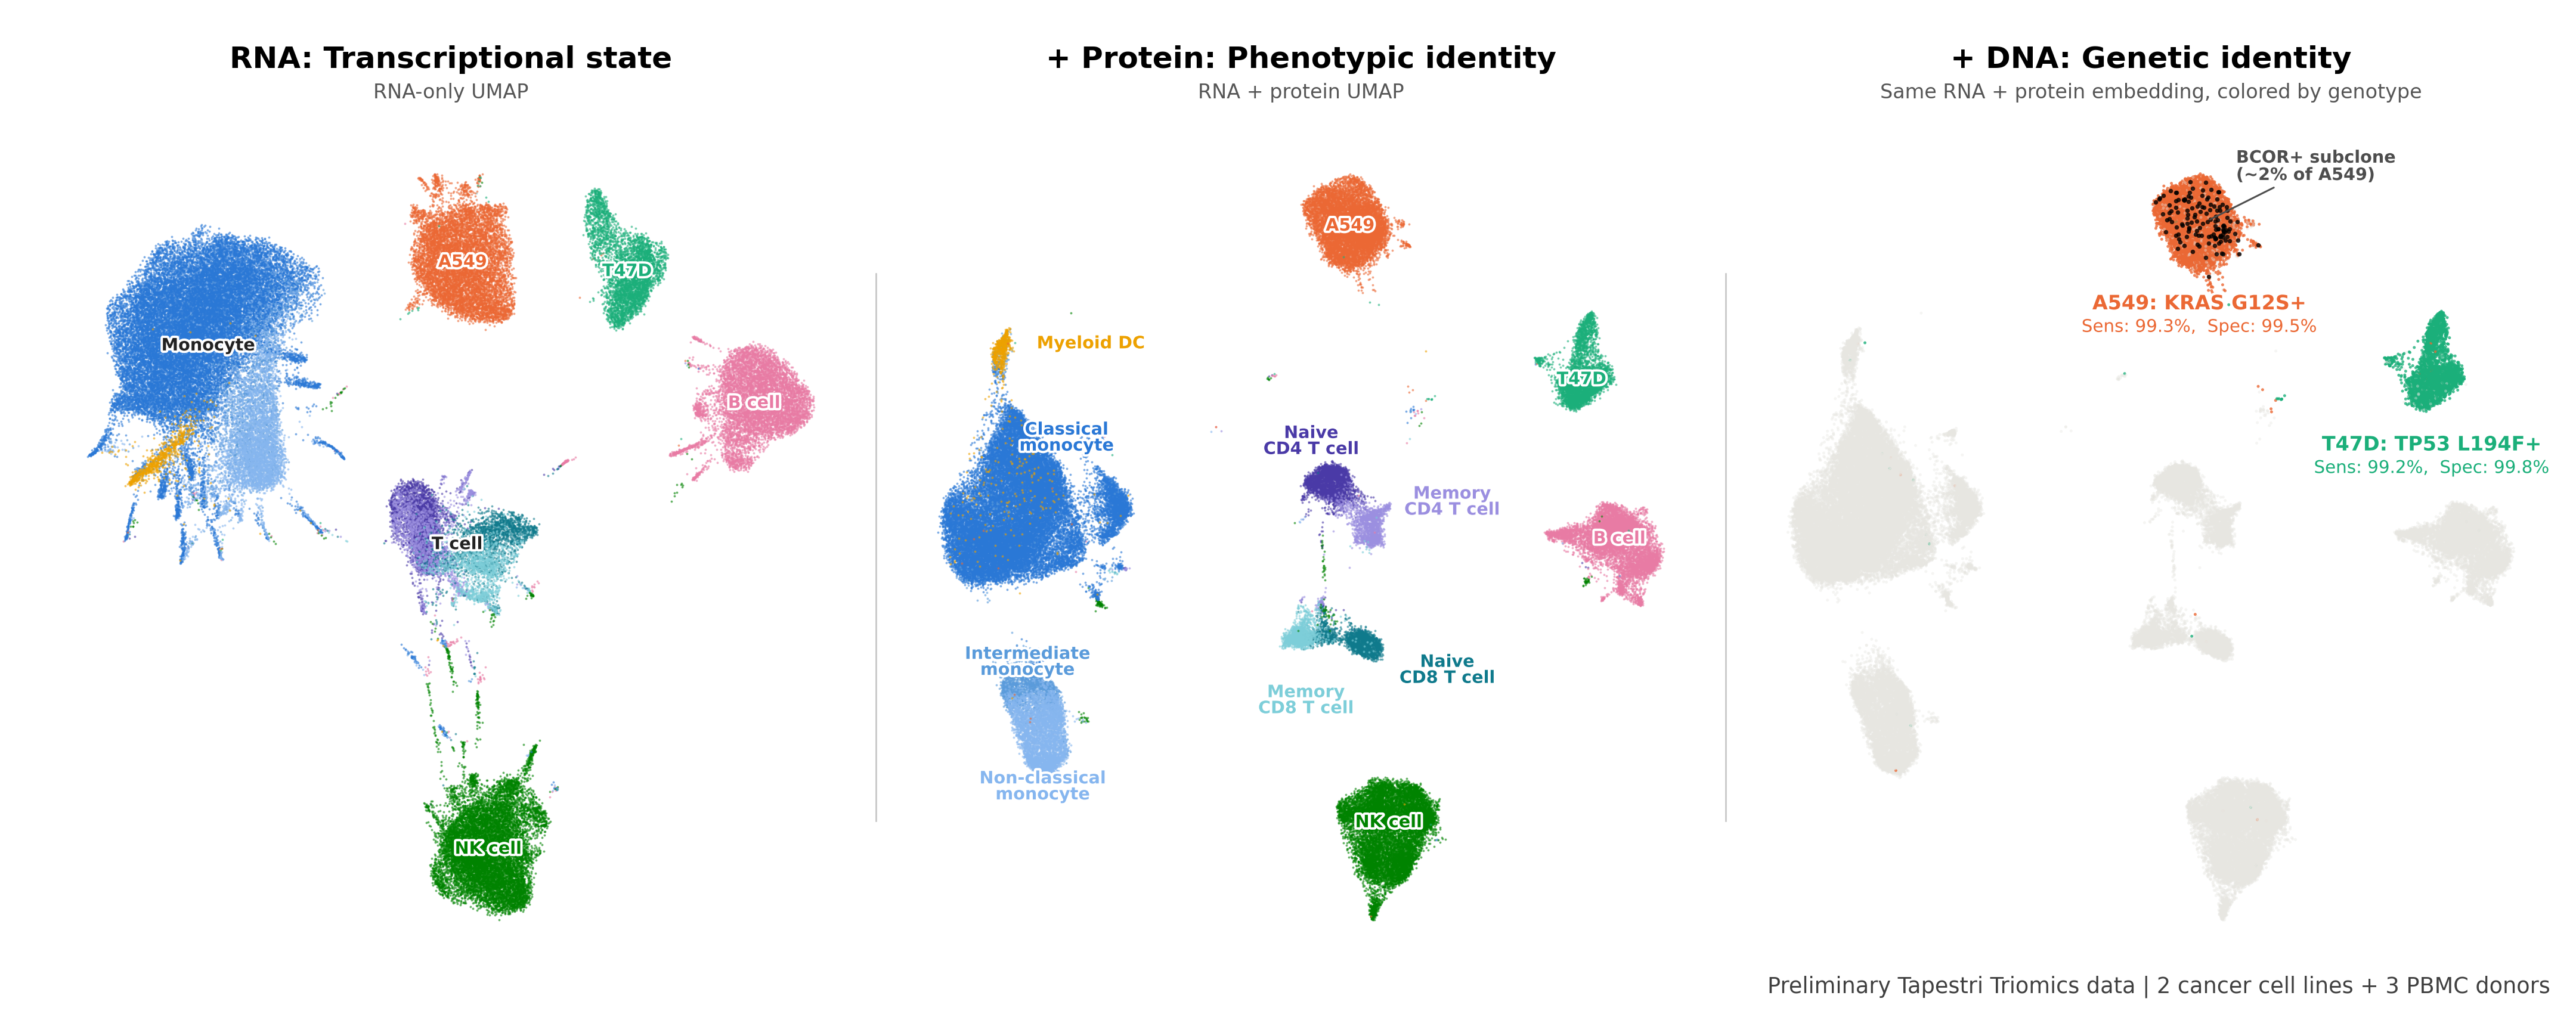
The data showcases five samples multiplexed in a single run: A549 and T47D cancer cell lines plus three PBMC donors. On the left we see that RNA alone resolves broad populations, but related phenotypes stay overlapping. Adding protein (middle figure) separates T-cell and monocyte subsets and captures what each cell presents on its surface. Adding DNA to those same cells (right figure) resolves single-base changes cell by cell: the KRAS G12S variant marks the A549 cell line (shown in orange), the TP53 L194F variant marks T47D (shown in green), and a BCOR variant reveals a small subclone within A549 (shown in black) that forms no distinct RNA or protein population.
Preliminary Tapestri Triomics Dataset.
Tapestri Triomics- Genotype VAF Summary and Phenotype x Donor Expression Profile
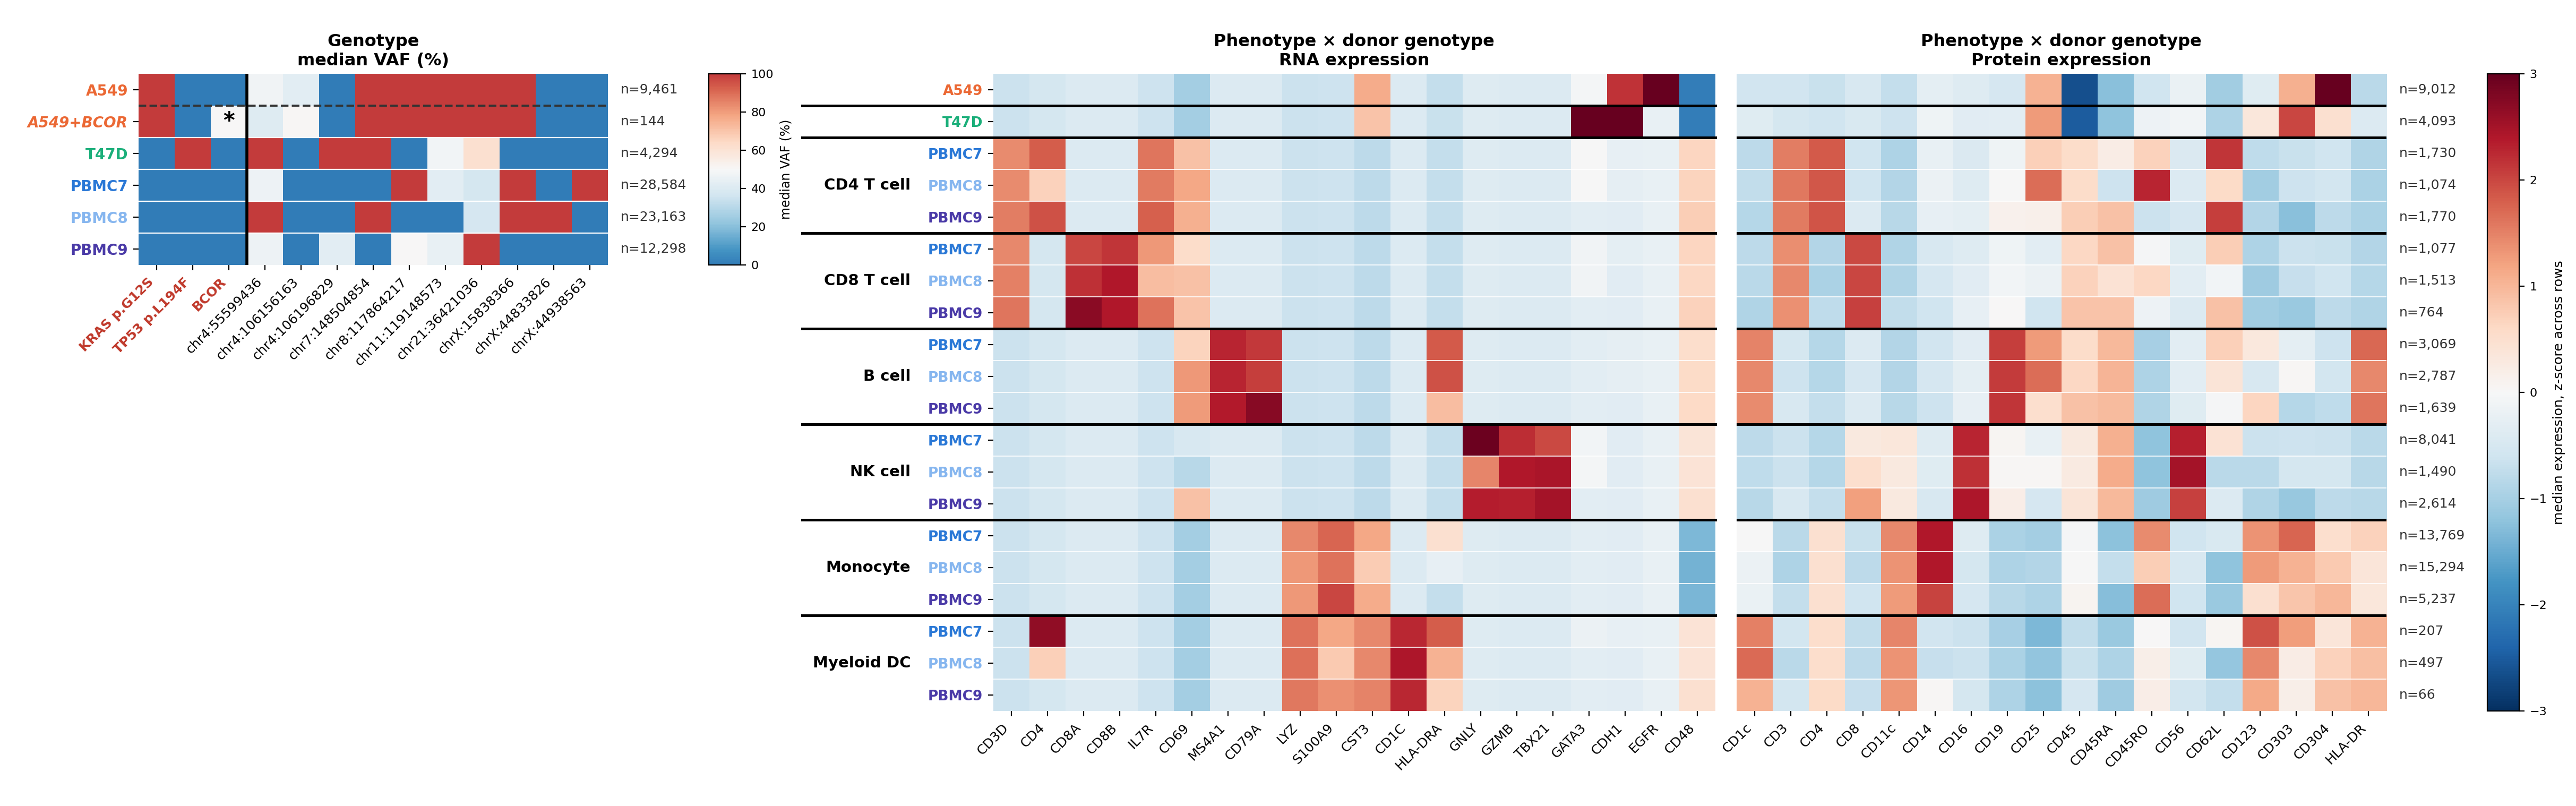
Single-cell DNA genotypes identify each sample and provide an anchor for downstream comparison. Within the same nominal cell type, different donors can show distinct RNA and protein signatures, revealing donor-specific cellular states that would be obscured by pooling cells by phenotype alone. This genotype-anchored view therefore connects sample identity to differences in cell-state and surface-expression programs across matched populations.
Preliminary Tapestri Triomics Dataset.
Hematological Malignancies
Resolve clonal architecture and track mutant subclones as they expand across AML, MDS, CMML, and related disorders — including the transitional states, like clonal hematopoiesis (CHIP) progressing toward overt malignancy, where population-level sequencing can't tell you which specific clone is on its way to becoming disease.
Mayo Clinic: Mayo Clinic's Division of Hematology has spent several years using Tapestri's single-cell DNA+Protein workflow to dissect clonal hematopoiesis, including a published proteogenomic profile of TET2-mutant premalignant and malignant myeloid disease (Lasho et al., Leukemia, 2023). That group is now extending the same body of work into Triomics — adding single-cell RNA to their existing DNA and protein readout to trace how individual mutant clones change transcriptional state and surface phenotype as CMML progresses toward AML, connecting genotype, expression, and immunophenotype in the same clone at every stage of transformation.
Cell and Gene Therapy Safety
Verify vector integration site, copy number, and on-target expression together, confirming safety in the engineered cell rather than in a population average. Adding protein resolves the question DNA and RNA alone can't answer on their own: which cell type was actually edited, and did it become the cell type the therapy was designed to produce.
Solid Tumor Cancer
Map intratumoral heterogeneity by linking somatic mutations to expression and surface phenotype within the same tumor mass — resolving how genetically distinct subclones differ not just in what mutations they carry, but in how they behave and what they present to the immune system or a targeted therapy.
University of Gothenburg: In a 2026 study published in The American Journal of Pathology, researchers led by Anders Ståhlberg and Göran Landberg used a Tapestri-based triomics method to profile DNA, RNA, and protein from the same single cells within patient-derived breast cancer scaffolds — 3D culture models that preserve the tumor microenvironment far better than standard monolayer culture. The study showed that all three analytes could be reliably measured together from the same cell, and that chemotherapy treatment reshaped both the composition of tumor cell subpopulations and their biomarker expression — heterogeneity that bulk profiling or any single-analyte method would have missed entirely (Filges, Jonasson, Leiva Arrabal, et al., Am J Pathol, 2026;196(4)).

From Blueprint to Expression: Expanding Mission Bio’s Single-Cell Toolkit with Targeted DNA + RNA Analysis
At Mission Bio, we’ve long enabled researchers to interrogate the genetic underpinnings of disease at single-cell resolution through targeted DNA analysis. DNA gives us the foundational “blueprint” of each cell — the static architecture of mutations, copy number changes, and clonal structure that define cell identity and lineage.
Mission Bio’s cloud-hosted Tapestri Pipeline accelerates your discovery with automated reports and comprehensive single-cell insights. Uncover clonal heterogeneity and phylogeny while seamlessly analyzing integrated RNA and protein expression clustering in one unified platform.
One connected software stack carries DNA, RNA, and protein from panel design through analysis to clonal visualization. Design custom panels in Tapestri Designer, process FASTQ files to single-cell output with the cloud-hosted Tapestri Pipeline, and go further in Mosaic, our open-source Python library for publication-ready UMAPs, heatmaps, and cohort-scale analysis.
Every run returns a complete, automated QC report which means no bioinformatics expertise required to go from raw sequencing data to single-cell insight. Prefer to keep analysis in-house? Tapestri Pipeline is also available for on-premise installation, and Mosaic is free to use, modify, and extend on GitHub for teams who want full programmatic control.
Learn more about Tapestri software pipelines.