
What is a disease model?
A disease model reproduces features of a human disease so it can be studied outside the patient: a patient-derived xenograft (PDX), an organoid, an induced pluripotent stem cell (iPSC) line, a cell line, or a CRISPR-engineered line.
Drug-discovery and translational programs depend on these models to test compounds, study resistance, and decide which therapies advance. A model earns that trust only while it still represents the disease it was built from, at the resolution the biology requires.
The cells that matter most are hidden in the average
A model is not one genotype but a population of genetically distinct clones. Treat it with a compound and those clones do not respond as one: some are killed, some persist, some carry resistance. The readout you measure is their sum.
A bulk method reports that sum, one variant frequency per locus. So the clone that survives treatment is lost in the background until it expands, and a model that has drifted from the disease it models can still show all its expected driver mutations.
For a drug-discovery or translational program, the conclusion you draw about a compound is only as trustworthy as the model you tested it on, and the resolution at which you read that model.
Why reading a model's response is uniquely hard
The difficulty is not detecting mutations. It is knowing which cells carry which mutations, whether that composition has changed under treatment, and whether the model still represents the disease you are studying.
Averaging hides the responders
The clones that survive treatment, or carry resistance, often begin as a small fraction. A population average reports one number per locus and cannot separate a rare resistant subclone from noise until it expands.
Edits and alleles hide in the mix
In an engineered model, a bulk readout shows an edit is present somewhere in the pool, not whether the intended edits co-occur in the same cells or which allele each edit is on.
Identity is not fidelity
STR profiling confirms a line's identity, the right inexpensive first check for any model. It says nothing about whether the internal clonal architecture still matches the disease or the design you test against.
One analyte is not the whole model
A model must match its source at more than one level: the clonal genotype, plus the RNA expression and surface proteins a therapy may target. Reading one analyte hides drift in the others.
Where traditional methods fall short in understanding disease models
Each traditional method addresses part of the question and leaves the rest uncovered. Single-cell resolution is the layer you add for the parts they cannot reach.
STR profiling
The standard authentication that a line has not been swapped or contaminated, inexpensive and the right first check for any model.
Structural limit: confirms identity, not internal clonal architecture. A correctly labeled model can still have drifted.
Bulk targeted DNA and NGS
Accurate population-level variant calls across many loci at once, sensitive to mutations present in the sample.
Structural limit: reports averages. A variant frequency tells you a mutation is present, not which cells carry it, and not whether a rare clone is surviving or expanding.
Flow cytometry and karyotyping
Resolve surface phenotype or large structural events.
Structural limit: neither reads genotype at single-cell resolution, so neither reconstructs clonal architecture or confirms that engineered edits co-occur.
STR profiling
The standard authentication that a line has not been swapped or contaminated, inexpensive and the right first check for any model.
Structural limit: confirms identity, not internal clonal architecture. A correctly labeled model can still have drifted.
Bulk targeted DNA and NGS
Accurate population-level variant calls across many loci at once, sensitive to mutations present in the sample.
Structural limit: reports averages. A variant frequency tells you a mutation is present, not which cells carry it, and not whether a rare clone is surviving or expanding.
Flow cytometry and karyotyping
Resolve surface phenotype or large structural events.
Structural limit: neither reads genotype at single-cell resolution, so neither reconstructs clonal architecture or confirms that engineered edits co-occur.
How single-cell resolution reveals what drives your disease model
Single-cell sequencing genotypes thousands of cells from one model, so the model resolves into discrete clones rather than one average. Measure cell-surface protein or targeted RNA in the same cell, and each clone's genotype is paired with its expression. Two questions a population average cannot answer become visible: which cells carry which mutations, and which of them a treatment selects.
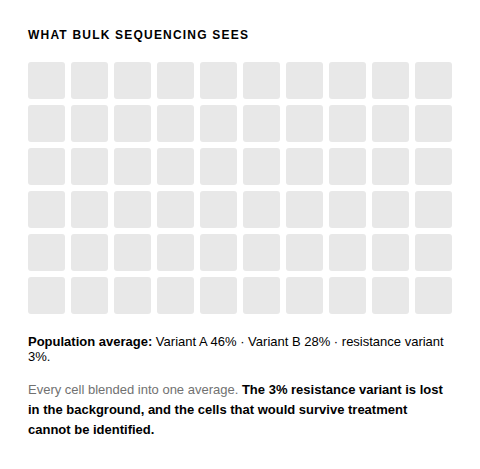
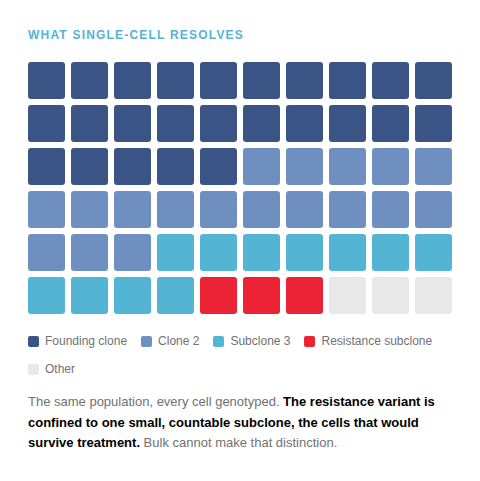
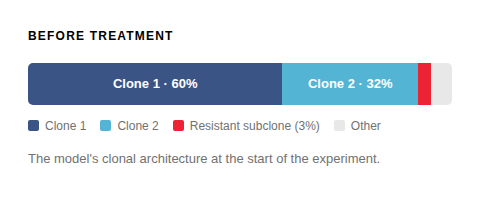
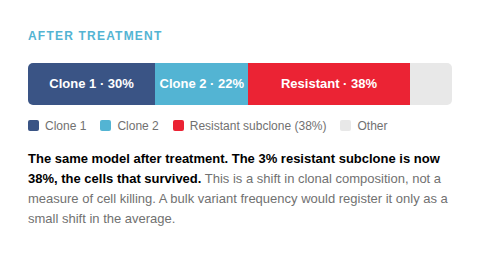
Illustrative schematic, not data
Reading the same cell for DNA with protein, or DNA with targeted RNA, characterizes a surviving clone: the genotype that persisted and what it expresses. Mission Bio offers DNA with protein and DNA with RNA today.
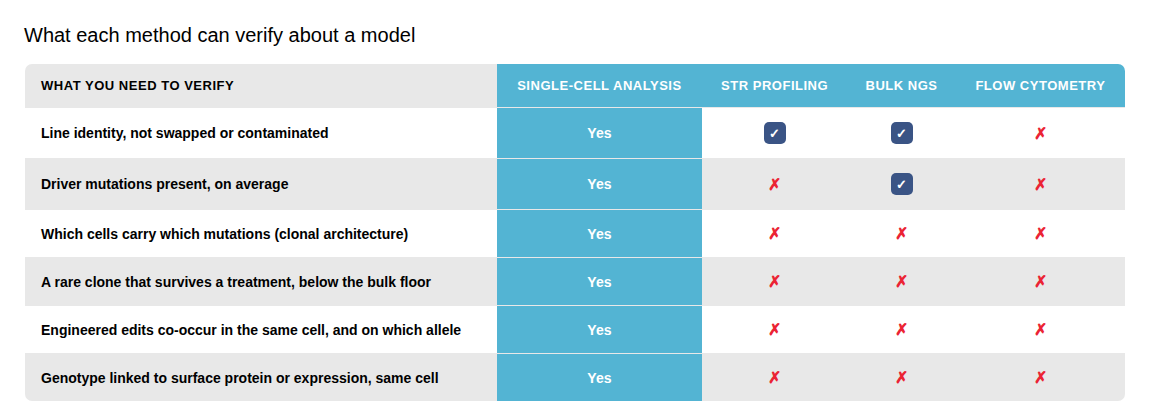
Several methods confirm a line's identity. The rest of the table, which cells carry which mutations, which clone a treatment selects, and whether engineered edits co-occur, is answered only by reading genotype in each individual cell. Illustrative comparison of method capabilities, not a benchmarking study.
One consideration to note: targeted single-cell DNA sequencing is panel-based, not whole-genome. It reads single-nucleotide variants and small indels at designed loci at clonal depth; copy-number changes and structural variants, including translocations, are resolved where the panel covers them. For genome-wide de novo discovery, it is combined with broad-survey methods.
Applications in drug discovery and translational research
The same per-cell readout answers two questions a drug-discovery or translational team faces: whether a model is the right one to test on, and how its clones respond once you do.
Use case 1
Verify and select the model before you test on it
Before committing a program to a model, confirm it recapitulates the source at the clonal level and carries the genetic profile you expect. For engineered models, confirm the intended edits co-occur in the same cells and on the expected alleles. Run several candidate models or timepoints together and pick the one whose clonal and multi-omic profile best matches the disease you are studying.
Evidence: multiplex editing generates low-frequency events a population readout misses (Samuelson et al., Molecular Therapy: Methods & Clinical Development, 2021); minor clones are selected on engraftment and passage (Eirew et al., Nature, 2015; Ben-David et al., Nature Genetics, 2017).
Use case 2
Confirm how your lead candidates perform
Once you narrow to your top lead candidates, single-cell DNA reads which clones survive a treatment and which are depleted. Protein or RNA from the same cell shows what the survivors express, so a resistance-associated genotype an average would mask becomes visible as it expands. The single-cell readout complements your efficacy or dose-response assay rather than replacing it: the assay reports how much the model responded, single-cell reports which cells responded and why.
Evidence: clonal selection through culture changes drug response (Ben-David et al., Nature, 2018); single-cell DNA and protein reconstructs clonal architecture and mutation co-occurrence directly (Miles et al., Nature, 2020; Morita et al., Nature Communications, 2020).
The same readout extends downstream: the genetic profile you confirm in a model can inform enrollment criteria and trial design, and the same assay runs on the samples a trial generates, grounding the clinical rationale in clonal evidence rather than a population average. Patient stratification and trial design happen downstream, but they rest on what you established at the bench.
Key publications
Peer-reviewed work on how the clones a model carries change its drug response, how models drift through passaging, and how single-cell resolution reconstructs clonal architecture and verifies engineered integrity.
How Mission Bio's Tapestri® Platform reads it
The Tapestri Platform is a microfluidic single-cell system that profiles thousands of cells, pairing high-throughput genotyping with optional cell-surface protein readout using ready-to-use or custom panels. Read a model before and after treatment to see which clones survived, or at two timepoints to see whether its clonal architecture is stable. For patient-derived xenografts, the analysis separates human tumor reads from mouse stromal reads.
Because DNA is read alongside protein, or targeted RNA, in the same cell, a clone links to the markers used to identify it and to what it expresses. Antibody-based sample multiplexing runs several models or timepoints in one experiment, with reported reagent and hands-on-time savings. The Tapestri Pipeline and Insights return an interpreted, visual result, so a lab without a dedicated bioinformatician can run the analysis. The work can run in your own lab, transfer to a CRO or CDMO partner, or run as a managed project through Mission Bio's Pharma Assay Development (PAD) Services.
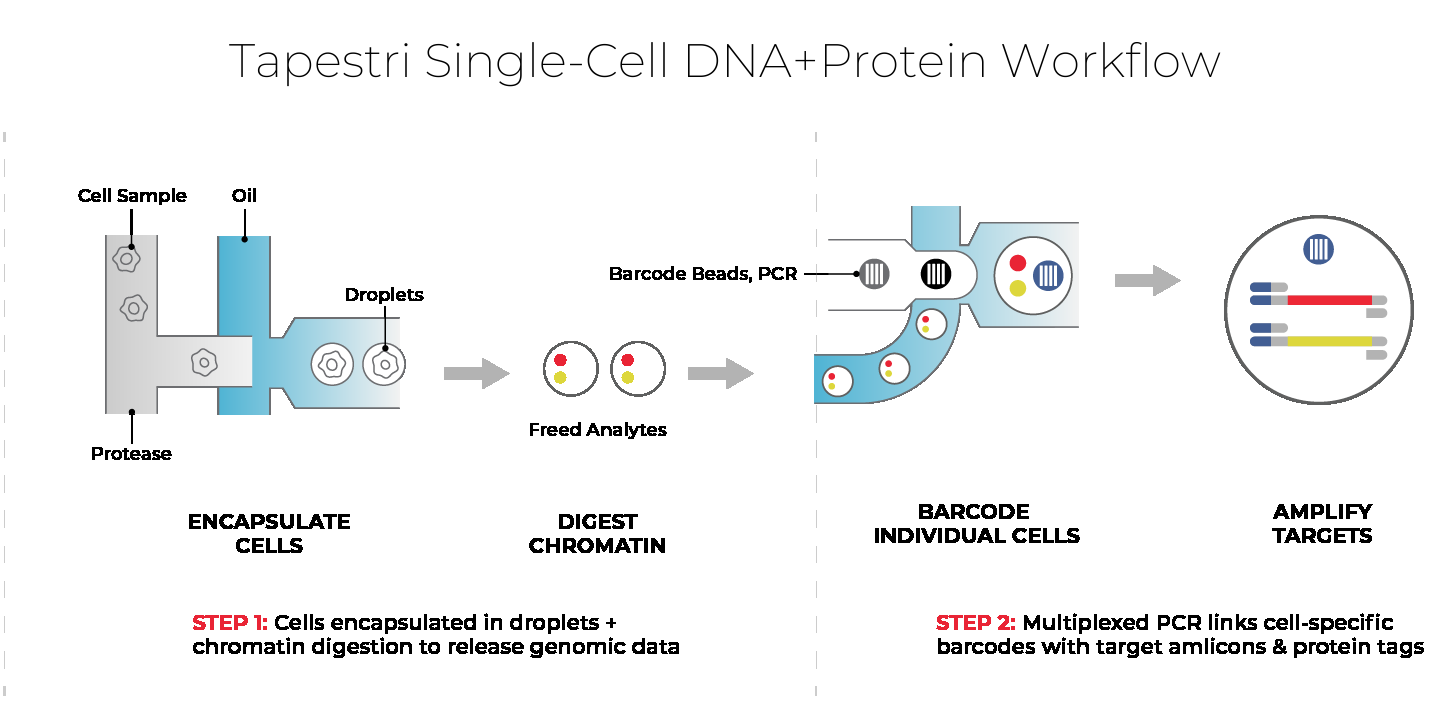
DNA + protein, from the same cell. Click to view full size.
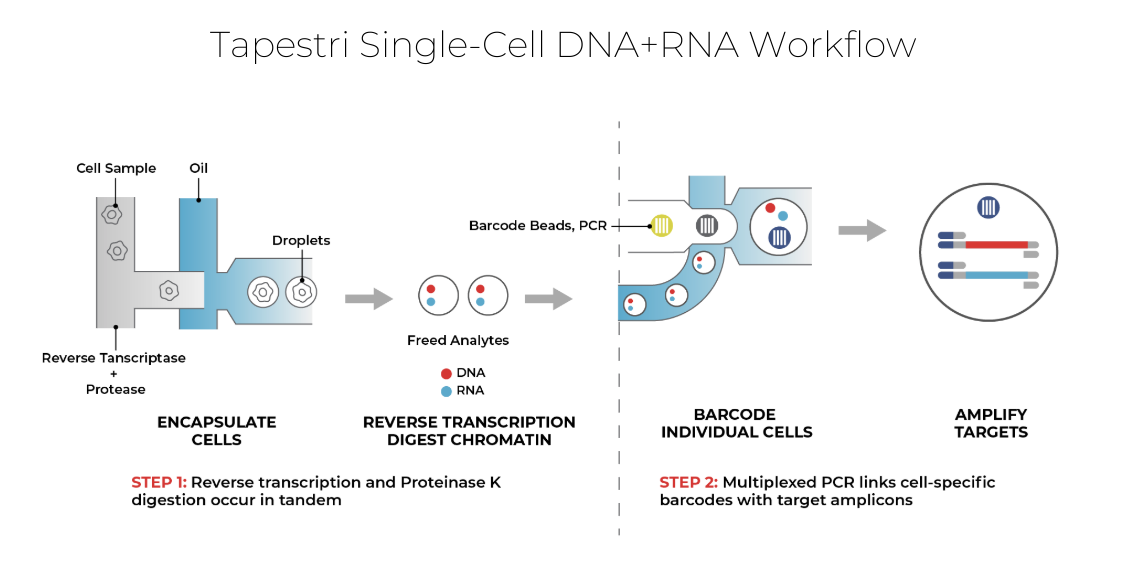
DNA + RNA, from the same cell. Click to view full size.
Pre-designed and custom panels for disease models: