Mission Bio Tapestri Targeted DNA + RNA Concordance with 10X Genomics® Whole-Transcriptome Sequencing.
Concordance metrics averaged across 2 independent Mission Bio Peripheral Blood Mononuclear Cell (PBMCs) datasets and 10 independent 10x Genomics® PBMC datasets from 10 different donors, spanning multiple Chromium™ chemistries. Error bars represent inter-sample standard deviation.
Sample characteristics
All samples are healthy, unsorted PBMCs from different donors. The Mission Bio samples were generated using the Tapestri® Single-Cell Targeted DNA + RNA Assay, which simultaneously captures targeted gene expression and DNA genotype information from the same cell. Specifically, the Mission Bio samples were processed with the Tapestri Single-Cell DNA Myeloid Catalog Panel alongside the 25-gene RNA panel; however, the DNA-related genotyping data is not shown in this concordance summary, which focuses exclusively on comparing the RNA component against 10x Genomics whole-transcriptome data. The intentional diversity of donors, chemistries, and cell counts across ten 10x Genomics datasets spanning 5 different chemistries provides a rigorous test of cross-platform concordance under real-world variability.
Mission Bio Datasets (2 donors)*
Dataset | Donor | Chemistry | Cells (post-QC) |
|---|---|---|---|
PBMC7 PBMC8 | Healthy donor 1 Healthy donor 2 | v3 DNA+RNA v3 DNA+RNA | 2,202 2,389 |
10x Genomics Datasets (10 donors)
Dataset | Donor | Chemistry | Cells (post-QC) |
|---|---|---|---|
10k 5'v2 PBMCs 10k 5'v2 Chromium X 10k 3'v3 PBMCs 5k 3'v3.1 (isoform) 10k 3'v3.1 Parent 5k 3'v3.1 ch5 5k GEM-X Donor 2 5k GEM-X Donor 4 10k GEM-X TotalSeq-B 7k 5'v1 VDJ | Male, 27 Female, 25-30 Healthy donor Healthy donor (StemExpress) Female, 25 Healthy donor (AllCells) Male, 18-35 Female, 36-50 Male, 18-35 Healthy donor (AllCells) | 5' v2 (Dual Index) 5' v2 (Chromium X) 3' v3 3' v3.1 (Dual Index) 3' v3.1 (Dual Index) 3' v3.1 GEM-X 3' v4 GEM-X 3' v4 GEM-X 3' v4 + TotalSeq-B 5' v1 + VDJ + TotalSeq-C | 10,237 8,429 10,690 4,823 9,385 3,778 5,886 5,550 10,304 6,953 |
* A subset of a multiplexed Tapestri run was used to generate the Mission Bio data.
Pre-processing summary
Mission Bio (Two datasets)
Each dataset processed independently from raw h5. Log-normalization (scale 10k). No HVG selection. PCA → UMAP → Leiden on all biological panel genes (FP controls removed). Cell types annotated via anchor gene scoring.
10x Genomics® (Ten datasets)
Each dataset processed independently from raw h5. QC (MT% < 15%) → log-normalization → 2,000 HVGs → PCA (50 PCs) → full-transcriptome UMAP → Leiden. Same anchor gene scoring for cell type annotation. No cross-platform integration applied.
Figure 1. Aggregate mirrored dot plot
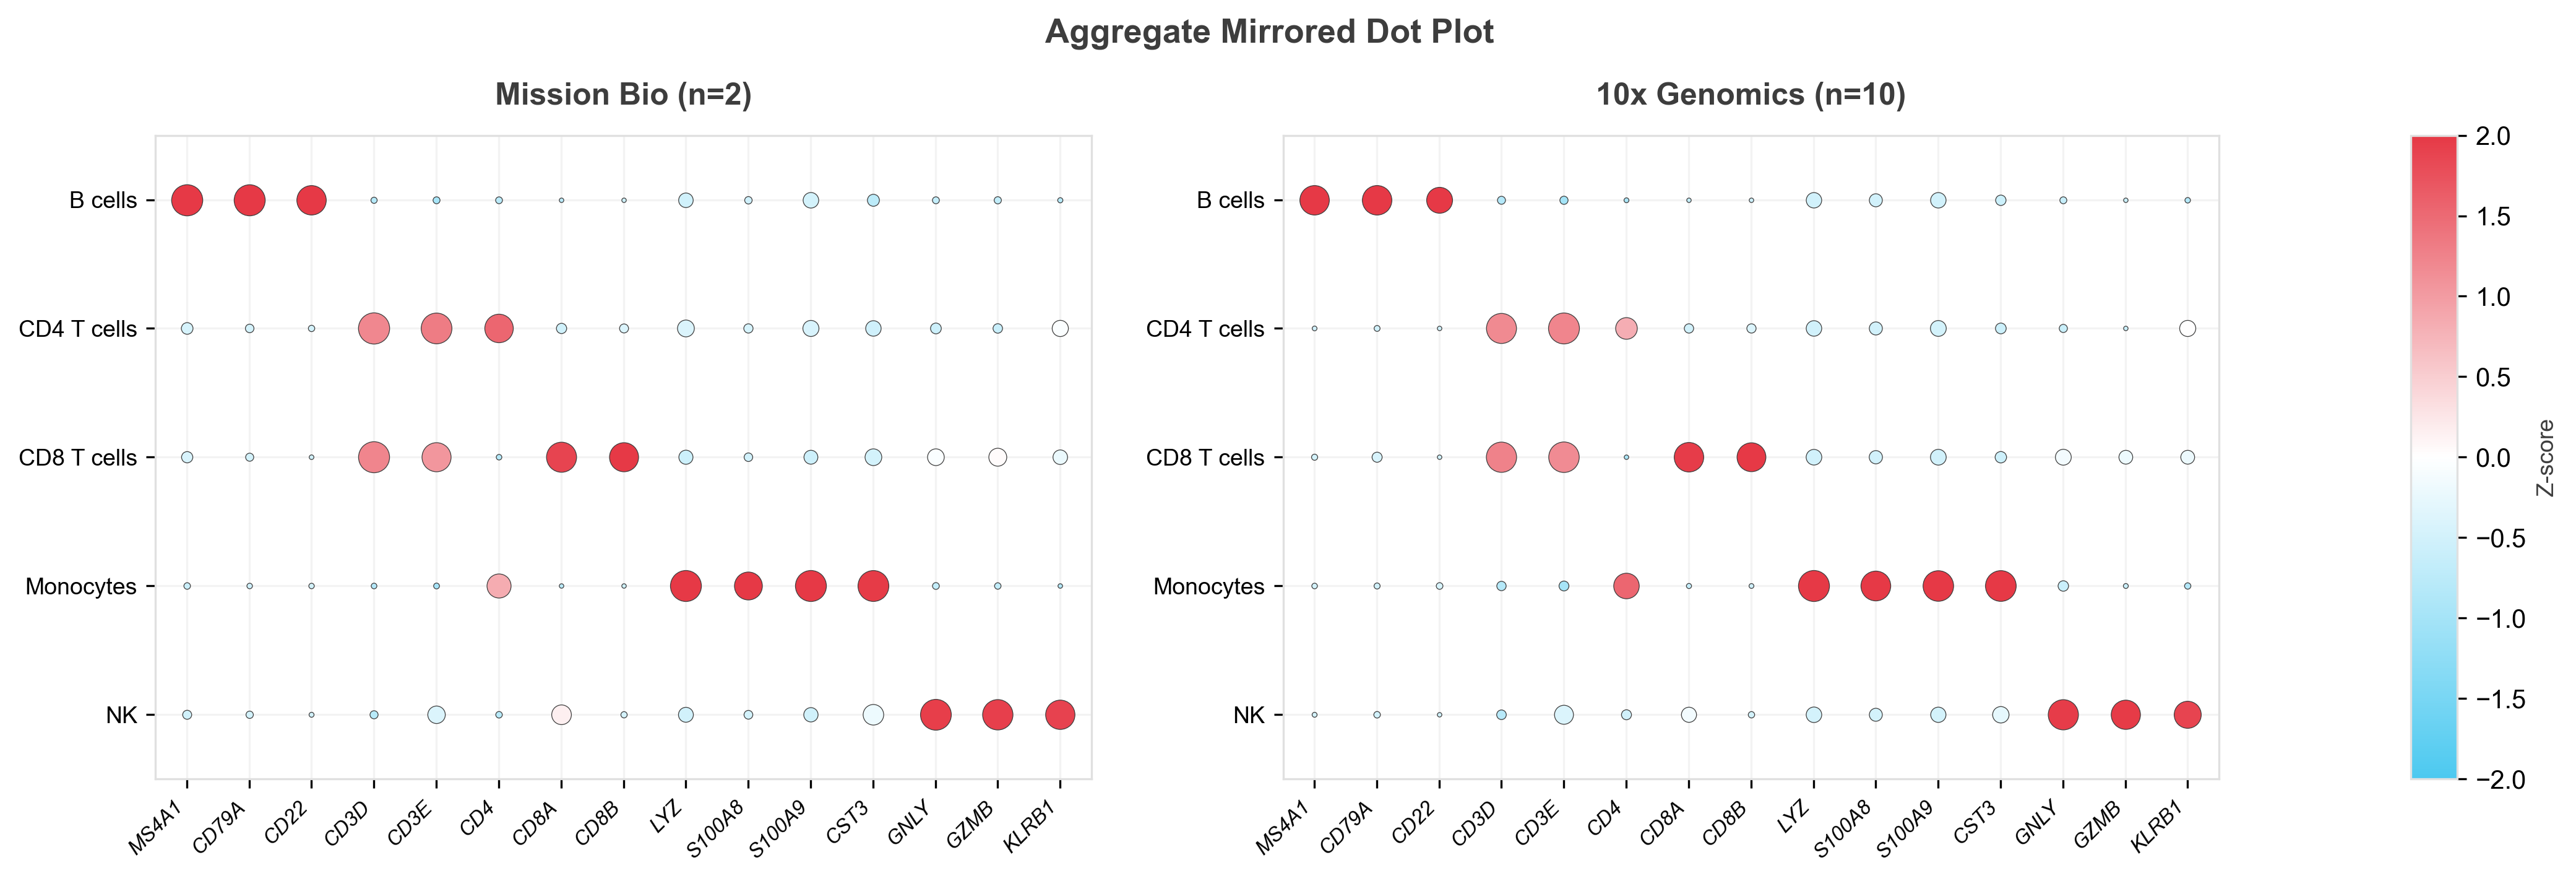
Figure 1. Mirrored dot plot on average expression across 2 Mission Bio (left) and 10 10x Genomics® (right) samples. Concordant marker enrichment confirms cross-platform agreement.
Figure 2. UMAP projections (all cells combined)
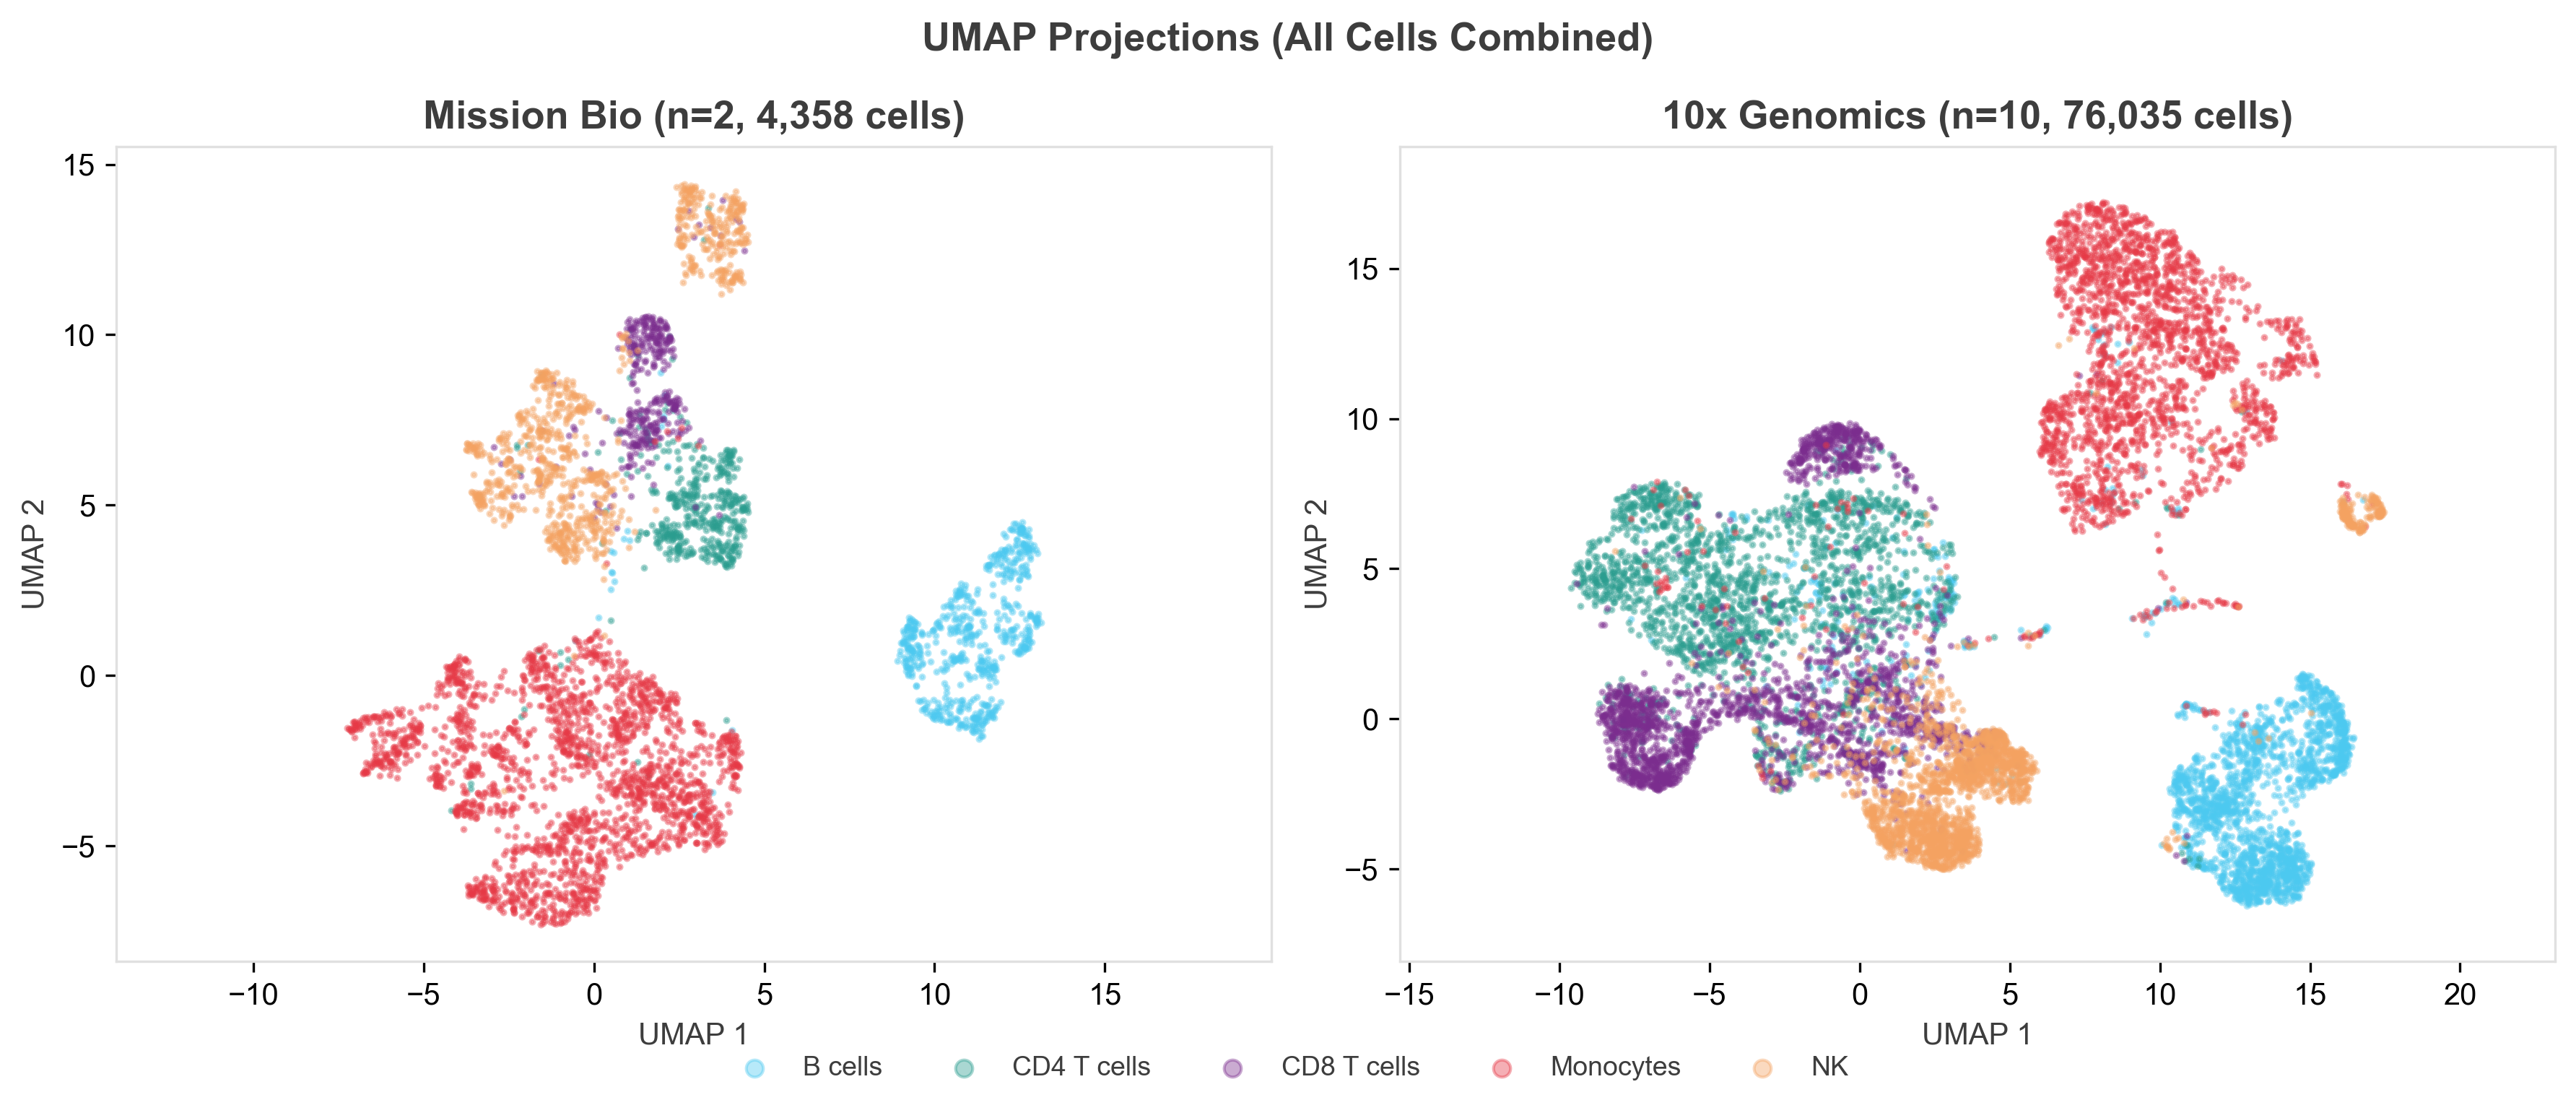
Figure 3. Expression distributions (box plots)
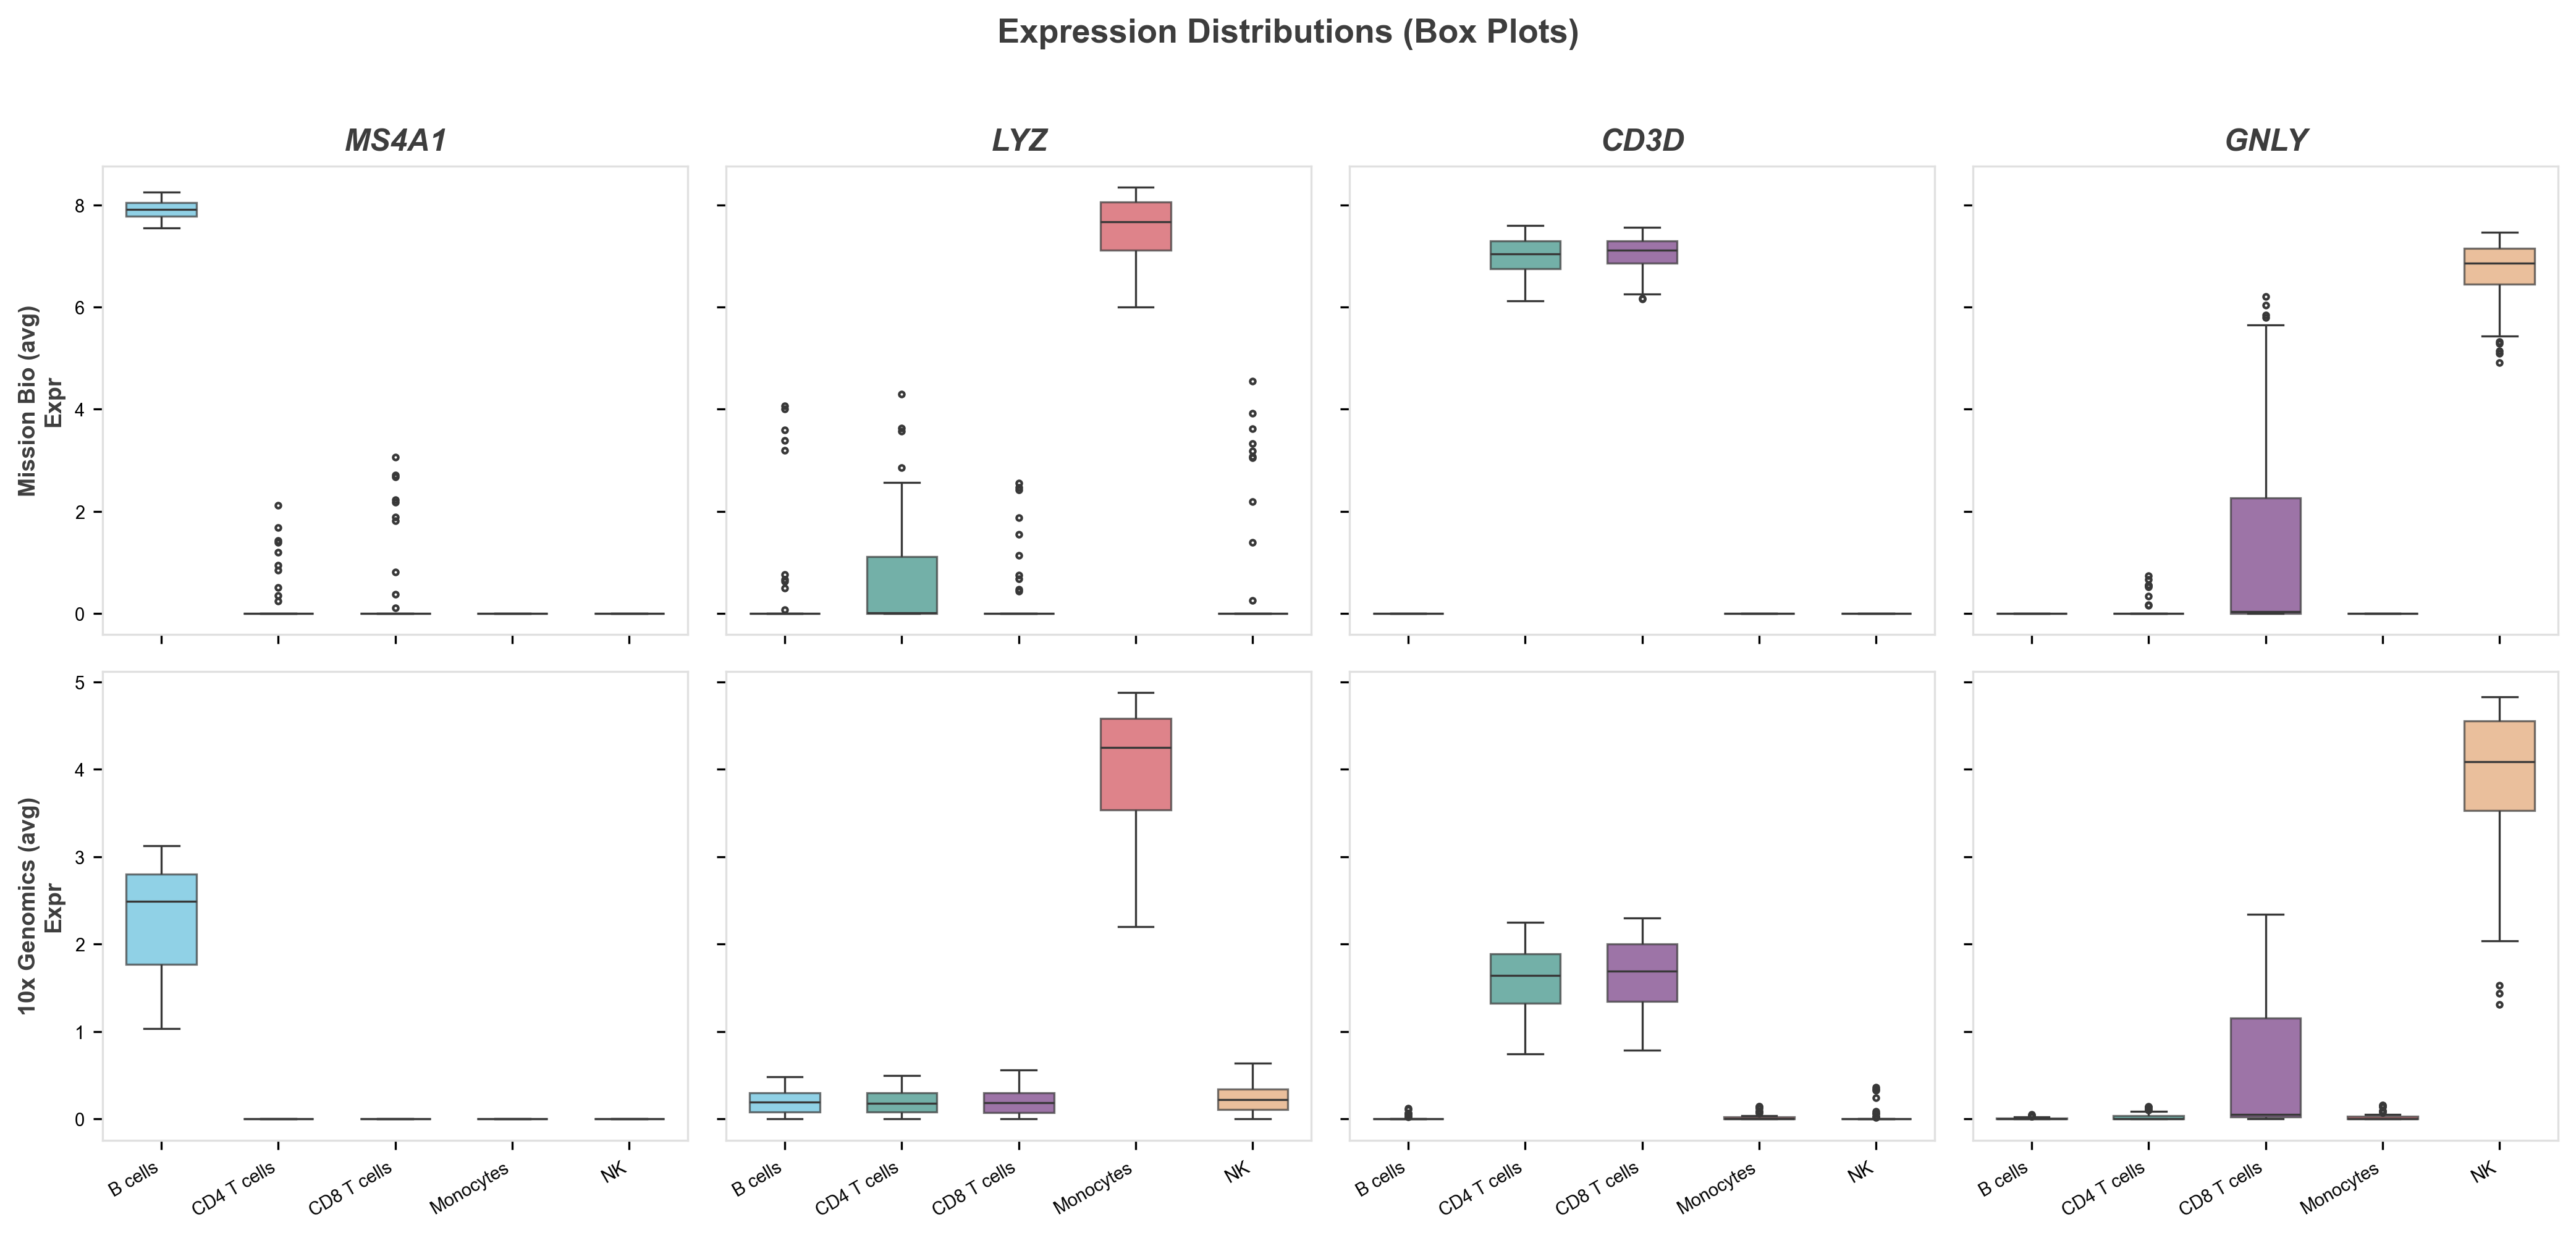
Figure 3. Box plots for key anchor genes, averaged across samples. Mission Bio (top) and 10x Genomics® (bottom).
Figure 4. Log₂ Fold-change (aggregate ± SD)
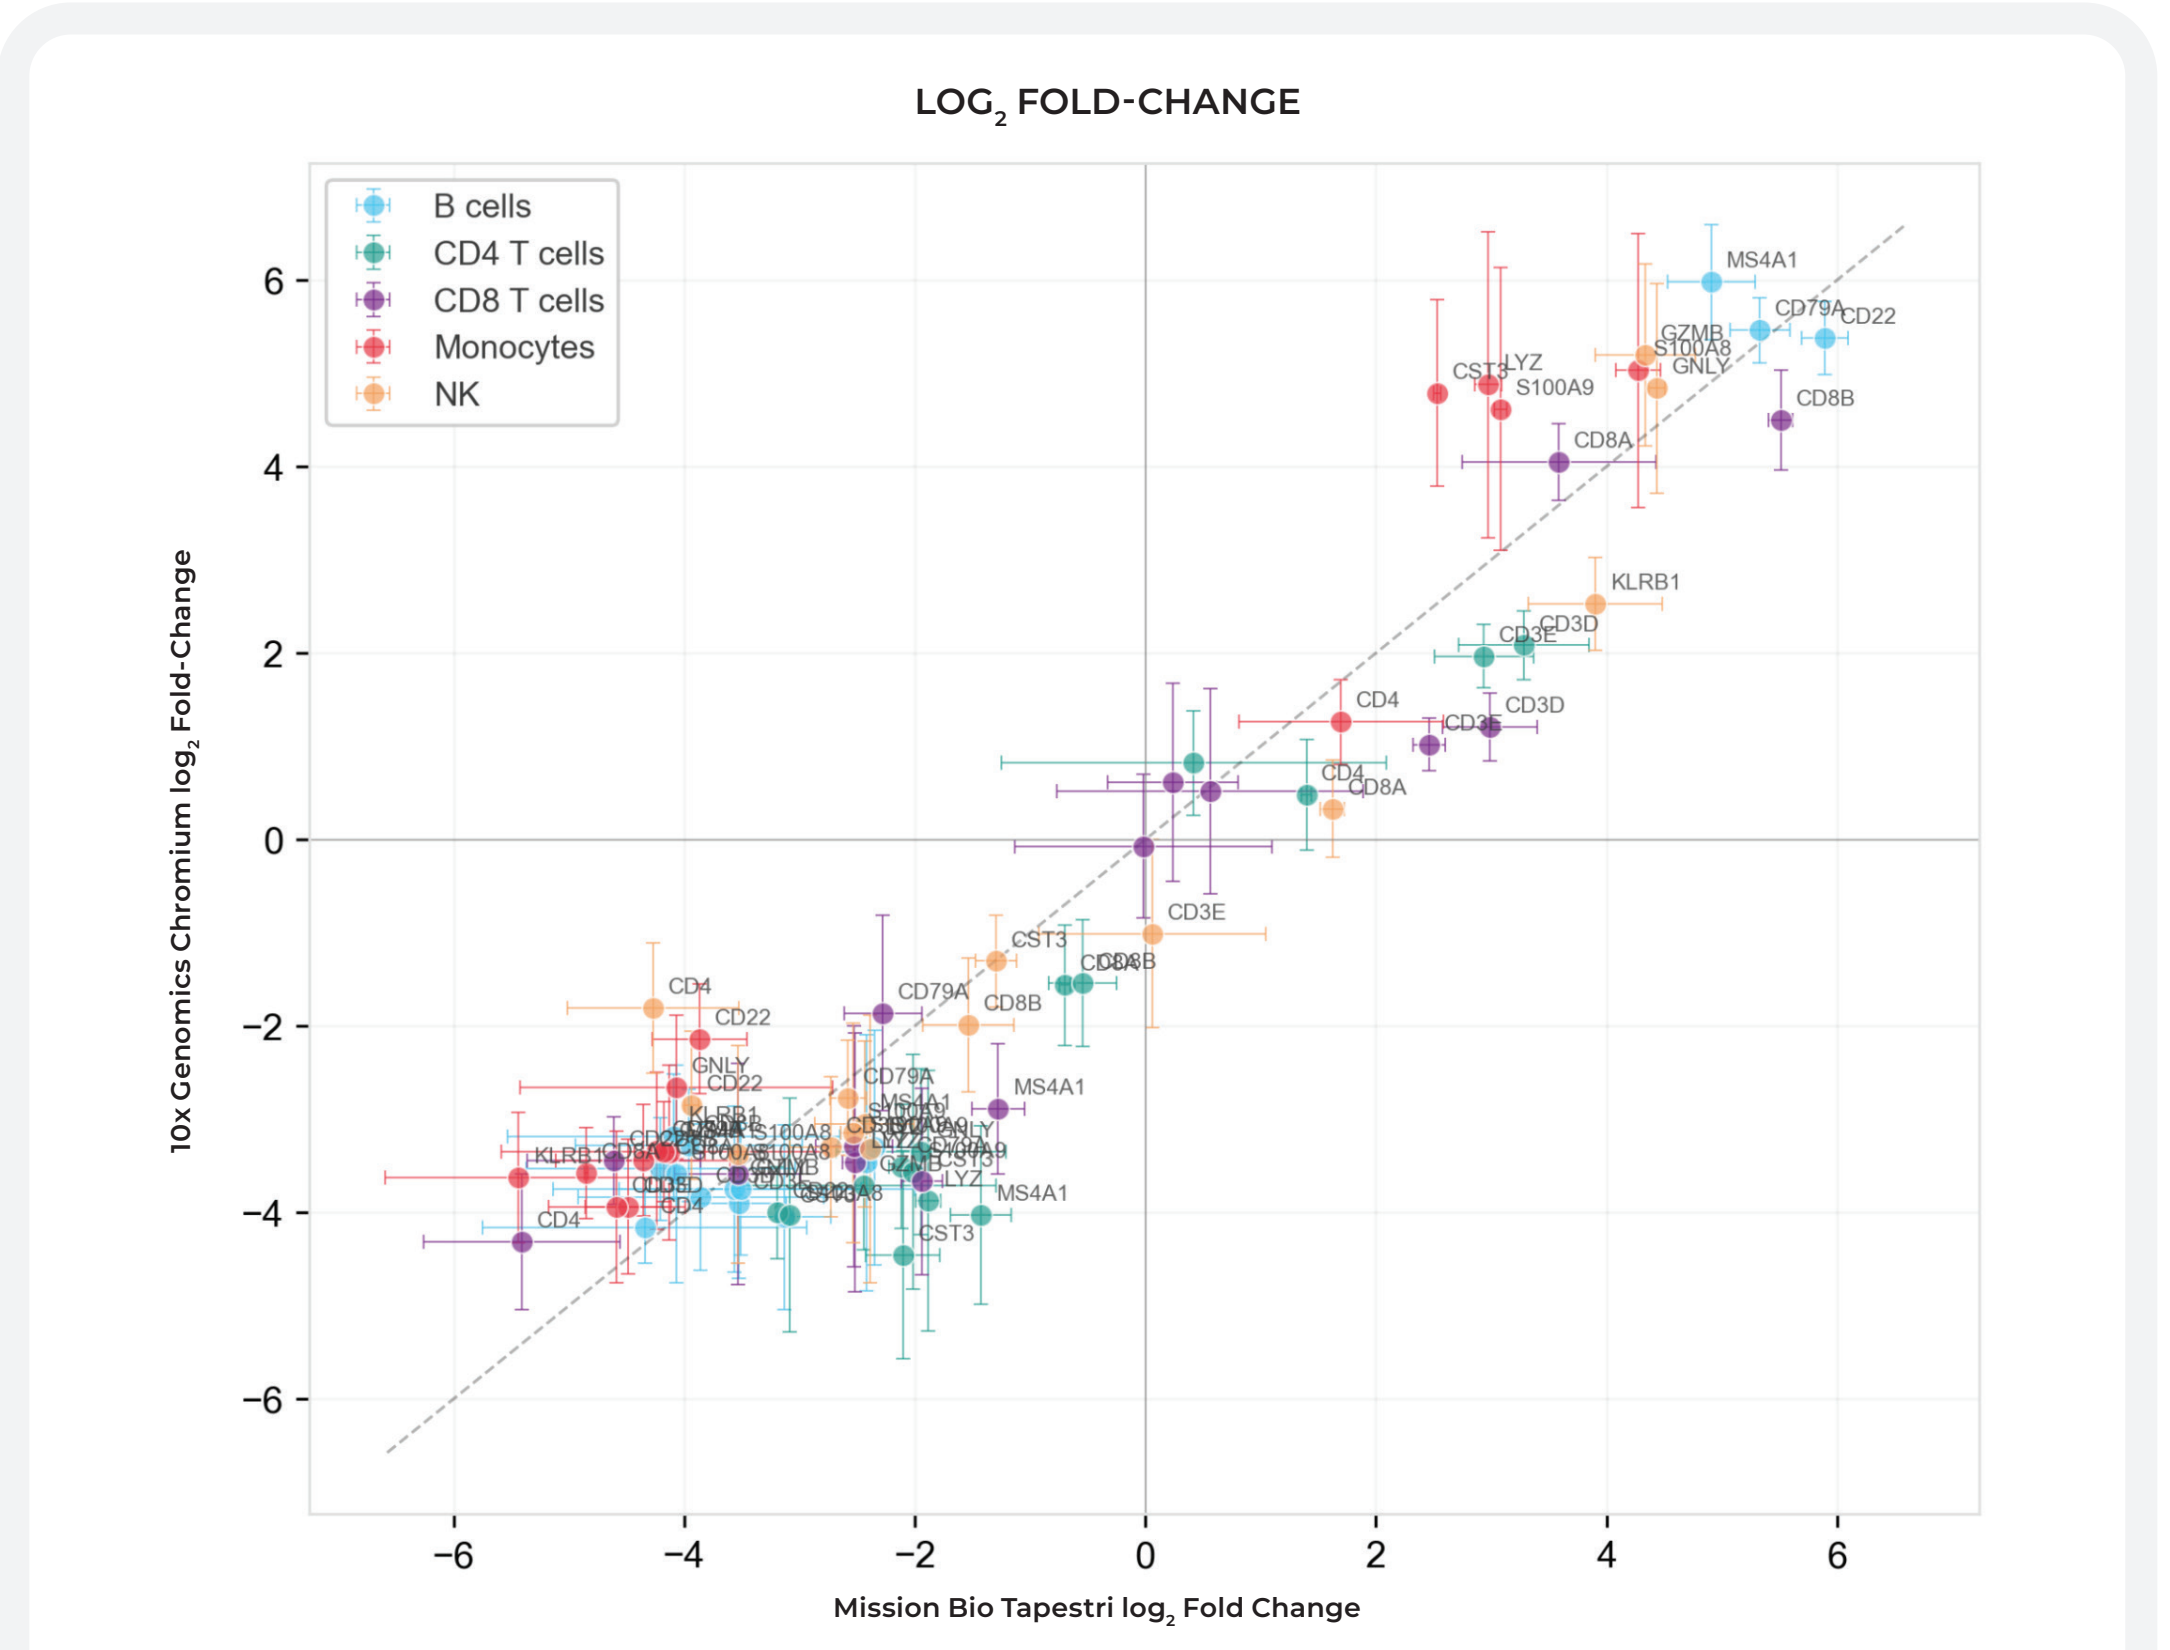
Figure 4. Log₂ fold-change on aggregate means. Crosshairs = ± 1 SD. Pearson R shown upper-left. Tight clustering along the diagonal confirms consistent differential expression.
Summary: Mission Bio delivers 10x Genomics®-equivalent RNA performance — with more

Equivalent RNA quality with additional DNA-level genotype information (data not shown). Across 20 pairwise comparisons between Mission Bio and 10x Genomics® — spanning 10 different donors and 5 different Chromium™ chemistries — Tapestri's 25-gene targeted panel identifies the same major PBMC cell types with equivalent accuracy. The mean Pearson coefficient of 0.94 demonstrates that relative gene expression rankings are preserved cross-platform, confirming that Tapestri's targeted RNA data is on par with whole-transcriptome results.
The concordance argument. This study demonstrates that Mission Bio targeted RNA is not a compromise — it is a validated alternative that delivers equivalent cell type resolution compared to whole-transcriptome platforms. A curated 25-gene panel captures the same biological signal needed for PBMC lineage classification as profiling ~20,000 genes. While this study focuses on PBMCs as a well-characterized benchmark, the underlying principle — that carefully selected lineage markers can recapitulate whole-transcriptome cell type identification — is expected to extend across tissue types and applications. The same panel design approach can be applied to tumor microenvironment profiling, bone marrow characterization, and other complex tissues where targeted markers are well-established.
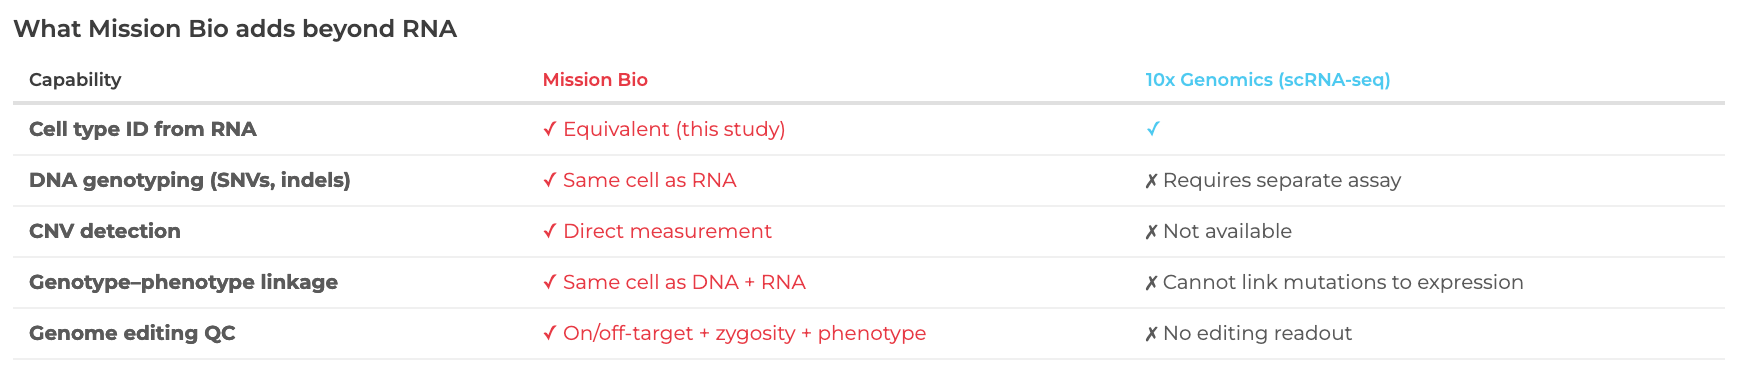
The multi-omics argument. Unlike any whole-transcriptome platform, Mission Bio simultaneously measures DNA variants (SNVs, indels, CNVs) and gene expression from the same individual cell. This DNA+RNA capability enables researchers to directly connect somatic mutations to transcriptional phenotype, track clonal evolution with cell state context, and validate genome editing outcomes with cell type confirmation — applications that are fundamentally inaccessible to RNA-only platforms regardless of their transcriptomic depth.
The translational argument. For clinical applications like MRD monitoring, clonal tracking, and therapy response assessment, Mission Bio provides the multi-omic depth needed for actionable insights — linking genotype to phenotype at single-cell resolution across longitudinal timepoints.